Statistical Mean Reversion: Trading with Z-Scores
Avoid the emotional pitfalls of FOMO and Panic by adopting purely statistical, deterministic trading strategies based on standard deviations and Z-Scores.
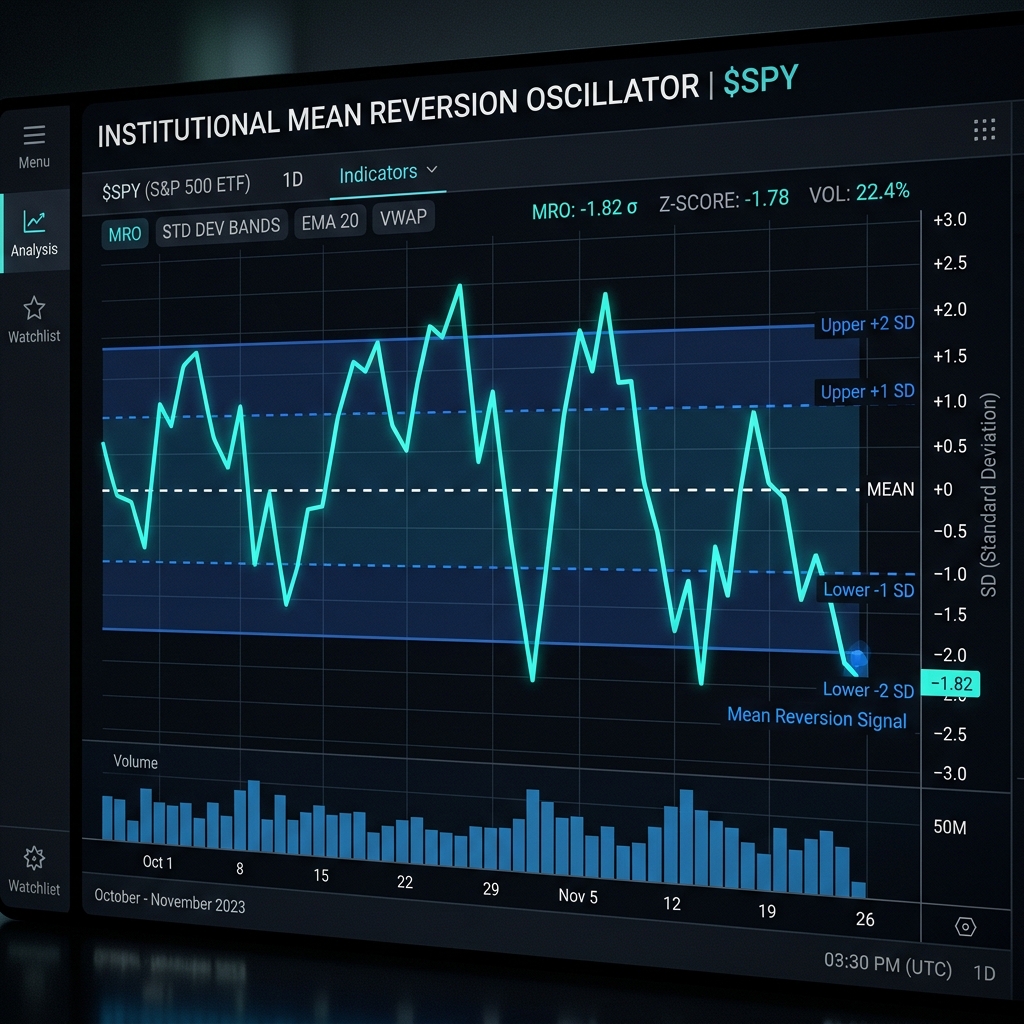
play_circle Institutional Mean Reversion & Z-Scores Masterclass

Strategic Briefing: Advanced guide to trading statistical mean reversion using Z-Scores and standard deviation.
The Mathematics of Market Noise
In highly volatile markets, price action is dominated by behavioral economics - specifically, the alternating extremes of greed and panic. A quantitative trader does not guess when a trend will end; instead, they measure exactly how mathematically irrational the current price has become.
What is a Z-Score?
A Z-Score is a statistical measurement representing the number of standard deviations a data point is from the mean of its historical distribution. In trading, we apply the Z-Score to various metrics including price momentum, funding rates, open interest, and social velocity.
- Z-Score of 0: The asset is trading exactly at its historical average. No edge exists.
- Z-Score of 1.0 to 1.5: The asset is establishing a definitive trend. Momentum traders seek these levels.
- Z-Score > 2.5: The asset is moving mathematically three standard deviations faster than normal. This represents an extreme statistical anomaly.

Fading the Crowd: Mean Reversion setups
A fundamental law of financial markets is that prices eventually revert to their mean. When an asset like Dogecoin spikes to a sentiment Z-Score of 3.5 while its underlying liquidity Z-Score remains at 0.5, the move is unsupported by capital and purely driven by retail euphoria.
AlphaSignal's Strategy & Backtester hub generates deterministic Mean Reversion signals the moment an asset hits an extreme, uncorrelated Z-Score. By patiently waiting for these mathematical anomalies, traders execute purely objective contrarian setups with massive profit potential.
Ready to apply this strategy?
Access real-time, deterministic signals and institutional liquidity tracking directly in the AlphaSignal terminal.
LAUNCH TERMINAL