Support and Resistance Fundamentals
Identify the structural foundation of price action. Learn how to map out historical supply and demand zones effectively to frame your trades.
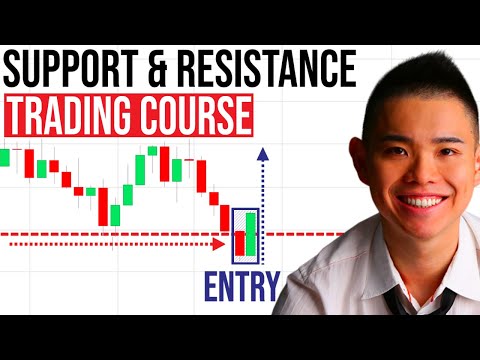
play_circle Mastering Support and Resistance: The Institutional Framework
Strategic Briefing: Learn how to identify structural supply and demand zones, map volume profile confluence, and avoid retail stop-run traps.
The Architecture of Price
At its core, financial trading is a continuous auction. Support and Resistance represent the fundamental laws of supply and demand acting on a chart. These are not arbitrary lines; they are psychological and institutional memory banks where major capital previously changed hands.
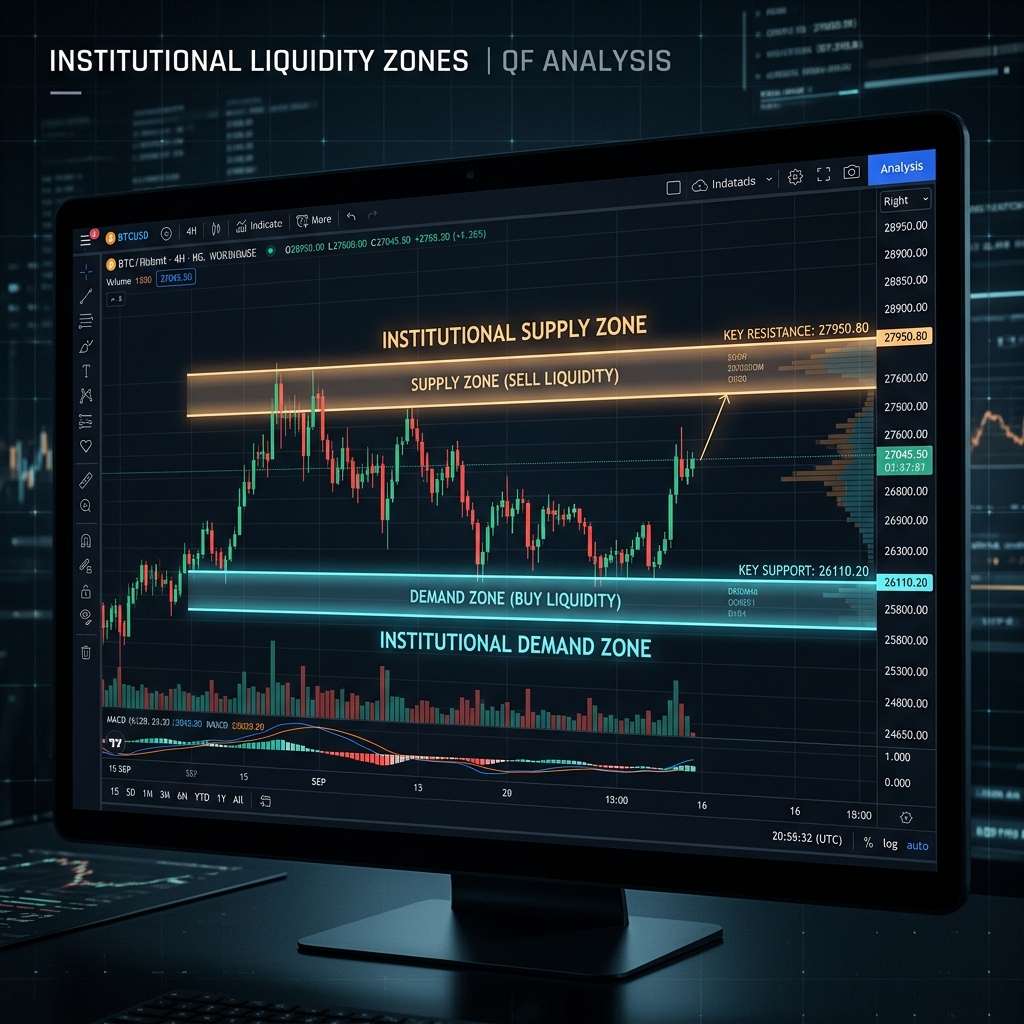
Defining the Zones
Support: A price zone where demand (buying pressure) has historically overwhelmed supply, preventing the price from falling further. It acts as a "floor."
Resistance: A price zone where supply (selling pressure) historically overwhelms demand, preventing the price from rising further. It acts as a "ceiling."
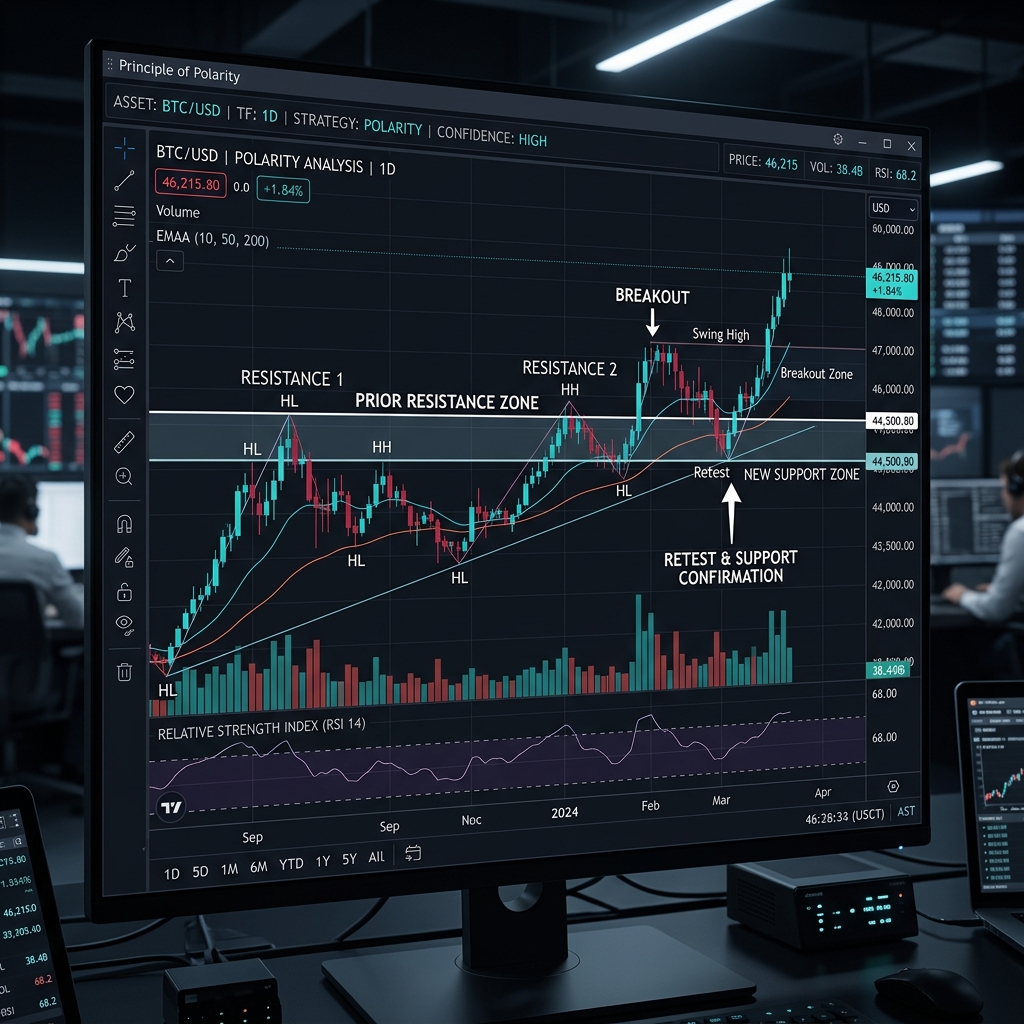
Polarity and Institutional Magnetism
One of the most reliable concepts in trading is the Principle of Polarity: when a major resistance level is finally broken to the upside, it frequently becomes the new localized support level upon a retest.
While retail traders draw simple horizontal lines connecting wicks, institutional traders view these levels as broad "liquidity zones." The AlphaSignal Volume Profile tool abstracts traditional chart lines by plotting actual historical volume nodes, revealing the true depth and density of these support and resistance structures.
Ready to apply this strategy?
Access real-time, deterministic signals and institutional liquidity tracking directly in the AlphaSignal terminal.
LAUNCH TERMINAL